Leaderboard
-
brabus
Supreme User9Points4,832Posts -
HuggyU2
Moderator5Points2,879Posts -
BashiChuni
Supreme User4Points2,655Posts -
Smokin
Supreme User4Points1,150Posts


Popular Content
Showing content with the highest reputation on 02/16/2025 in all areas
-
4 points4 points4 pointsI love the passive aggressive approach to BS like this. I was directly told by my DO in 2008 that if I didn't wear a reflective belt out the door for the night sortie then I'd get no-stepped. So I doubled it up and wore it like a Jap about to do a Banzai. When I got the WTF look from him, I responded that it was far more visible and safer that way. My harness didn't cover any of it and the higher elevation would give greater visibility, and since safer is better, this should become the new standard. He turned around and basically stormed out. I got to fly my sortie and morally got a draw since I made the DO leave me alone for a while but at the cost of actually kind of wearing that absurd thing.4 points3 pointsYou're quoting a summary statistic that conveys information about groups who use any program and collecting it all underneath one metric. This incorporates social security. Which basically includes anyone who worked and paid taxes at some point in their lives. It's a bit of a stretch to consider SS under the same banner as food stamps, SNAP, WIC, or Section 8 benefits. Anyway, the more subsets you include in any statistic, the more it will display convergence towards the underlying population. So that's the literal, mathematical reason you're seeing that effect. The same exact site you provide allows you to answer your own question. If you select "Filter by Characteristics - Race" you'll be able to dig into the stats. For instance, you can see what @blueingreen is talking about if you look at WIC/SNAP by race: Section 8 benefits show a similar pattern. Effectively, you're missing examining the underlying populations, or stated differently, not restricting the data by subset.
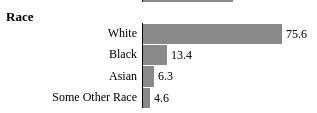
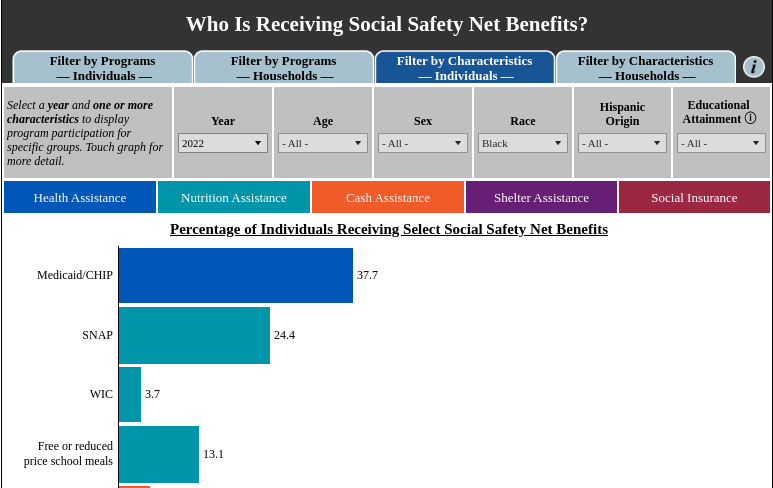
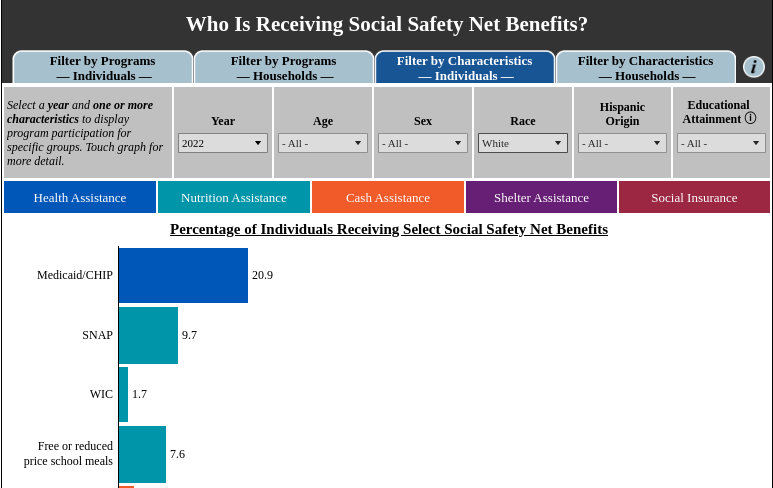 3 points3 pointsI disagree with the first (truncated) sentence; "no limits of evil" is an overstatement. He hasn't used artillery with chlorine, hasn't released weaponized plague...is he ordering mass rapes of sex slaves & posting it on the internet like ISIS? Hyperbole from the pro-UKR crowd turns off more listeners than gains converts. Putin is a murderous dictator for sure, and invading a sovereign country was wrong. Let's get over that and analyze COAs pragmatically because many mistakes thus far have been interwoven with grandiose moralism detracting from objectivity. I see zero evidence he wants a direct kinetic conflict with NATO. If anything, he has been reserved given what our side is doing. If RUS provided the Taliban major weapons systems, training right across the AFG border and live targeting the way we do... we'd have hit them directly. We would never accept from them what they are currently accepting from us. It's not from the goodness of his heart, it's because he's not strong enough to hit back or he knows he would lose a wider conflict or any number of reasons. But it shows a high degree of rational thought. I'm unwilling to pay anymore for Ukraine's defense and I'm unwilling to pay for Ukraine's reconstruction. I voted for somebody who is doing those things; it sucks for Ukraine, but life is unfair and my priority is my own country. Perhaps if UKR held elections or wasn't killing RUS civilians or hadn't blown the pipeline causing an environmental disaster I would entertain a conversation about "shared values" and "defending western norms" etc. but they're doing those things (admittedly in self-defense for a war they didn't start) so 🤷♂️3 points2 points2 pointsHow's that working out for our neighbors to the north...who brings a"go for the bronze" gusto that's done them so well over the years?2 points2 points2 pointsthis is the root cause of our disagreement. putin is VERY rational. he's been telling the west since 2008 what would happen if we seduce ukraine into nato. the CIA forcasted exactly what he'd do in the leaked mid 2010 "no means no" memo. if he wasn't rational then that CIA analysis wouldn't have come true.2 points2 pointsOn the Defense budget subject - spitballing, but could probably cut a couple hundred billion. Having seen deep inside the acquisitions side, all the way to sustainment (and what the warfighter gets for it), it is criminal the money the DOD wastes/misallocates/pays out as it willingly bends over and takes it from industry who enjoy near zero accountability. The DOD accepts shit like paying LM billions of dollars for “F-35 modernization” which really means “make it do the things you told us it would do in 2013.” The millions I spend referenced above should be 100s of thousands, but I don’t hate the player, I hate the game. And the DOD is OK with all of that…fuck us, we deserve to lose billions in funding when that’s how we spend tax payer dollars.2 points2 points2 pointsI had a pilot call in “Im showing no indication.” Tower asked them to fly by and was furious when they realized it. Several ass chewings later, it was still funny. Sent from my iPhone using Tapatalk2 points2 pointsWe can’t be too hard on Huggy, he did do UPT in a Stearman and has spent a lot of time at altitudes with very little oxygen.2 points1 pointAwesome explanation. I was getting those "no data available" results when I tried to filter the data down initially. Your point about the per capita consumption makes sense though given the data. Greatly appreciate the thorough response and additional sources of info!1 point1 pointFair question. The Census Bureau's interactive data visualization site isn't my favorite. The tool itself doesn't work too well. Try selecting specific categories of welfare programs to do a more granular analysis and the tool starts spitting out "no data available" depending on the combination of programs you select. And like you pointed out, it puts Hispanics and Non-Hispanic Whites into the same category, which isn't helpful. I'm not entirely sure how they built this tool, but it seems like they're not accounting for the relative size and scale of each program. When presenting data without weighting important information like beneficiary counts or spending shares, you can easily create a misleading sense of equivalence between programs like Medicaid (85 million beneficiaries, 50% of welfare spending) and smaller programs like TANF or WIC (less than 2% of welfare spending). This lack of context is pretty obfuscating. The Census data itself isn't bad -- it's great and offers a tremendous sample size, but the Bureau does a poor job of communicating that data. There are other organizations that take the same valuable data and communicate it better. Let's look at some of the biggest public assistance programs to get an idea of what's going on: Medicaid Spending FY 2023: $880 Billion Utilization: White 39.5%, Black 18.5%, Hispanic 29.9%, Asian 4.7%, Native American 1.0%, Multiple Races 6.0% Source: Kroger Family Foundation (Utilization), Kroger Family Foundation (Spending) Medicare Spending FY 2023: $1 Trillion Utilization: White 72.3%, Black 10.1%, Hispanic 9.8%, Asian 4.6%, Native American 0.4%, Multiple Races 2.7% Source: Kroger Family Foundation (Utilization), CMS.gov (Spending) Social Security Spending FY 2024: $1.5 Trillion Utilization: I couldn't find a simple breakdown except for at the Census Bureau site. Their numbers are: White 81.1%, Black 12.1%, Asian 3.7%, Other 3.0%. We know that non-Hispanic Whites are probably a large majority of that 81.1%. Source: CBPP (Spending), Utilization (Census Bureau) SNAP (Food Stamps) Spending FY 2023: $113 Billion Utilization: White 35.3%, Black 26.0%, Hispanic 15.1%, Asian 3.7%, Native American 1.4%, Multiple Races 0.6%, Race Unknown 17.6% Source: USDA (Spending), USDA (Utilization, Table 3.6, Page 29) There's a pretty clear pattern emerging here: Universal public assistance programs designed for old people who have worked and paid taxes their whole lives are utilized the most by Whites, but not at exceedingly disproportionate rates when you account for the racial demographics of the elderly (75% of Americans age 65+ are non-Hispanic Whites). Other public assistance programs are disproportionately used by Blacks and Hispanics, often at rates that are 1.5 - 2.0x higher than you would expect for a population of their size; AKA higher per capita consumption.1 point1 pointI was more addressing the way forward, using the failures of the F-35 program as an example of what not to repeat. How are relatively recently written contracts written, and have we learned anything from previous fiscally retarded contracts (the answer is no)? Many weapons programs are also great examples of what not to repeat. We absolutely can start today not signing contracts that don’t include favorable condtions for the gov. We kick cans down the road so egregiously already, so fuck it, I’m fine with kicking some stuff down the road a few years until primes start bending the knee a bit. I’m with you on that. There does need to be some trust busting done with the big primes. It has become well out of control. I read a book about industry leading up to WW2, the differences in mindset is staggering - they were whole heartedly pro-America; current day LM, Boeing, etc. execs do not GAF about America.1 point1 point1 point1 point1 point1 point@Banzai I’m not saying you’re wrong in general, and you have valid points. If I truly sat down, went through the data, and DOGE’d this thing, what could the savings be? I did not get that number from any research or math, just thrown out as a starting point, knowing full well the number could, and probably would be less. - cut 1/2 the civilians and save approx $40B (based on average salary). Obviously I wouldn’t just blindly cut that right now, but i bet if you went full DOGE you’d find near half are unnecessary/not remotely earning their paycheck. Go work on the staff - that number is about 90-95%. Directly related to this problem are the processes of course, so you’d have to streamline our BS processes which in turn would nullify the need for the guy who provides the 3rd rubber stamp prior to sending the request to Bob - Industry: I think you’re wrong on that, fuck yeah we could tell them GFY and actually sign contracts that are judicious use of tax dollars. The F-35 program has doubled in cost for 1/2 the initial buy (and likely will continue to shrink), and all we do is throw billions at LM while they laugh at us. What if we signed all contracts with cost+ limits and delays/setbacks were 100% eaten by the company? You say no company would sign that? OK cool LM, we’ll go to your competitor, or we’ll just chill for 5 years on all your potential contracts - how’s that bottom line doing now? Industry is incredibly greedy - I’m a huge fan of capitalism, but capitalism does not mean you have to completely take it up the ass with a smile on your face. Long story short: many TRILLIONS saved over a few years if we took this approach across the DOD. Walk out of the car dealership - the dealer will call you more often than not. Theres a lot more, just two big ones off the top of my nugget.1 point1 pointMore US Hockey excellence...maybe we need a hockey thread to go along with football and the field fairys thread1 point1 point1 pointGreat memories…the stories I could tell (but not on the internet!) @Zero I remember 2008ish when we all were “fuck these gay scarves!” Fast forward to 2013 post-Shaw - “fuck you chief, check out my ascot!” The swings are humorous looking back.1 point1 point1 pointGood example of a squadron scarf. The LPAs out there don’t have a hair on their ass if they don’t get this done (unless getting away with morale shirts, then carry on).1 point1 point1 point1 point1 point1 point1 pointDOGE is going to force this guy to retire, and we'll finally be free of his tyranny!
 1 point1 pointI spent almost a decade in San Diego and it’s pretty common. Developers froth at the mouth at the idea of getting that land. It’ll never happen. Same as people bitch about San Diego airport and how it should move to Miramar and be a joint airfield with the Marines. The department of the Navy is well entrenched in San Diego and I think it’ll be a cold day in hell when they move out and let the city take over.1 point1 point1 point1 pointI can’t recall, I lost mine on a fishing trip to the Gulf of Buccees.1 point1 pointVisual search from the RJ approaching 300’/1nm from touchdown is a red herring. PCF: helo altitude control/vis lookout RC: asinine procedures IVO DCA IF: Change the procedures/amount of traffic using DCA/immediate surrounding airspace. This is an easy fix that should have, and could have, been done years ago Everything else is just noise in the big picture.1 point1 pointhttps://www.instagram.com/reel/DFyffoFycnT/?igsh=YzlndWNrNHE2Mmw2 well played internet1 point1 pointHis weaponized autism gets the best of him. He’s still the guy who’s selling beta full-self driving software on Teslas after years of it being in beta.1 point1 pointEasiest fix (besides meeting altitude requirements while flying in B): Tower shouldn't let helos maintain visual separation with an aircraft circling to land 33 at night. Also tower, should have pinged Pat about their altitude. You can easily see with your eyeballs that Pat was too high. That was the first thing I noticed watching the video of the collision. Edit: I used to teach dudes to hover or do 180 when traffic was landing to 33. It happened enough that I made it a point to tell the new guys I flew with about it, as my instructors did for me. It's generally a bad idea to fly under landing traffic on short final.1 point1 point


Account
Navigation
Search
Configure browser push notifications
Chrome (Android)
- Tap the lock icon next to the address bar.
- Tap Permissions → Notifications.
- Adjust your preference.
Chrome (Desktop)
- Click the padlock icon in the address bar.
- Select Site settings.
- Find Notifications and adjust your preference.
Safari (iOS 16.4+)
- Ensure the site is installed via Add to Home Screen.
- Open Settings App → Notifications.
- Find your app name and adjust your preference.
Safari (macOS)
- Go to Safari → Preferences.
- Click the Websites tab.
- Select Notifications in the sidebar.
- Find this website and adjust your preference.
Edge (Android)
- Tap the lock icon next to the address bar.
- Tap Permissions.
- Find Notifications and adjust your preference.
Edge (Desktop)
- Click the padlock icon in the address bar.
- Click Permissions for this site.
- Find Notifications and adjust your preference.
Firefox (Android)
- Go to Settings → Site permissions.
- Tap Notifications.
- Find this site in the list and adjust your preference.
Firefox (Desktop)
- Open Firefox Settings.
- Search for Notifications.
- Find this site in the list and adjust your preference.