Leaderboard


Popular Content
Showing content with the highest reputation on 11/27/2020 in all areas
-
4 points
-
3 pointsTo be fair, that applies to a lot of politicians from both parties. But yes, Newsom is tied for worst governor with several others...can’t decide who’s a bigger POS, but there’s several who keep trying to out-do each other for that coveted title.3 points
-
2 pointsThis is the crux of the problem in current politics. We’re made to think we have significantly different views, but that’s because we basically have to choose one of two sides: 1) Dems: We aren’t doing enough and we need to lock everything down needlessly without considering one side 2) Repubs: We are doing too much and we need to remove everything we have done without considering one side In reality I think we probably look at the problem very similarly. We need more compromises. Honestly, this is where the president should “make his money,” by setting a national game plan and pushing down a path that hits both. Trump certainly didn’t do that well, and it doesn’t look like Biden’s going to, either. And when Biden encourages needless lock downs in cities with almost no one at risk, the cycle will continue.2 points
-
2 pointsExactly! It's been several weeks now and this is getting ridiculous. Could you imagine if a large percentage of the news pushed by media outlets was based on election hearsay rather than hard evidence for, say, the next 3 years?2 points
-
1 pointSeriously? Is this a Neil trap? Because if so, you totally got me. You just mixed two completely different data points (took the numerator from one and the denominator from the other) to generate a meaningless and irrelevant number. Data point 1: Rate per total population. This is all people, not just those who have/had COVID...so 330M total population is the denominator, not 12.7M cases. 228.7/100K means 0.23% of the population is/will be hospitalized for COVID over the course of the virus (and of course this is subject to change, but that’s what the data from the last 8 months shows). Go ahead and expand it out like you did, but 745,710 out of 330M is still 0.23%. Using the correct denominator for the dataset makes quite a difference. Data point 2: Rate amongst COVID cases 74,573 hospitalizations resulted from 12.7M COVID cases = 0.59% of COVID cases result in hospitalization. If I did what you did, then I could have used 330M for this data point’s denominator and claimed the hospitalization rate for people who had/have COVID is 0.022%...which is clearly incorrect. I’m good with that. But to go one more level for full “genuine-off,” let’s add that under 70 = 90% of the population. Let’s also not leave off that 10% of 70+ isn’t going to die because 100% of them aren’t going to get COVID. I can’t find the positivity rate broken down in age groups for national data, but if the national average is 12%, well I don’t imagine the rate for 70+ is as high as you may think. Data shows the positivity rate is higher among younger age groups, which makes sense based on the difference in lifestyles, social interaction, etc. For example, the latest data from NYC shows 18-24 have a 1.5% higher positive rate than 65-74 and 2% higher than 75+ (source:https://www1.nyc.gov/site/doh/covid/covid-19-data.page#perpos). I use NYC as an example because it’s on the higher end of the scale (worst? Haven’t looked at that comparison in a while). So that tells me the older groups have a lower national positivity rate than 12% because they’re not the demographic on the high end pulling the average up. So, let use 12% (generous) of the oldest 10% of the population will get COVID. Of that group, 10% will die (using your mortality rate form this post). Let’s say 30M in the 70+ group...360k deaths. But that’s likely too high due to using a 12% positivity rate. For reference my state (which has done well) has a 0.04% death rate for 70-79 and 0.09% for 80+...so let’s not gloss over the relatively “good news” while solely highlighting the specific dumpster fires. Either way, it still sucks, but it’s certainly not the 2.2M figure you threw out for this age group a page or two back. You’re misunderstanding my point then. I have never said this isn’t a big deal or not important enough to deal with, but we must make data-driven, unemotional decisions when it comes to wide scale public policy. I even concurred with your idea on financially supporting 70+ to enable self-quarantine, etc. Social distance, fine. Masks when meeting close contact definition, fine. Those are reasonable solutions. Destroying people’s livelihoods, putting education on pause, exacerbating/creating more mental health problems, telling people they can’t have grandma to their house for thanksgiving, and a long list of ludicrously illogical edicts are not reasonable solutions, especially when considering the unemotional data. If this was Ebola with a 50% death rate, well maybe this crazy shit would have to happen...but we’re not there, not even in the slightest. So yeah, we should care and do what we can to help others, but it’s pure ignorance, fear/other emotion, and/or thirst for power/gov control that is driving these bigger things I mention. The data alone does not lead a rational person to conclude these things are required/OK. The data does support things like social distancing, improved hygiene, quarantine when you don’t feel well/have been in close contact with someone who’s sick, etc.1 point
-
1 pointWarning: Long Rant What has anyone said that closely resembles the highlighted? While I may or may not agree with Brabus on some of his thoughts, his main point is that the response is overkill considering that the average age of death from COVID is essentially the average life span. You disagree, which is fine. I think the issue is that some people want to loudly force draconian measures on the entire population, whereas many want to be left alone while quietly letting you do what you feel is best. I suggest people rework the numbers to a more manageable scale, and understand that with the size of the global population there will always be anecdotal and wildly improbable events that tug at our hearts more than our heads. I like to consider the following scenario to put things into a better perspective: A town of 3,300 people (i.e. Unadilla, GA) has an identical population spread as the U.S.. A new virus is going around and over the course of nearly a year had claimed the lives of 3 elderly, 2 of which had co-morbidities. The three died at an average age of 75, 3 years before their expected age of death. In an effort to counter the virus the city council mandated that life as we know it come to a halt. Social distancing, closure of many businesses and most schools, no sports, etc. Additionally, the same council opened the coffers and spent $22,000,000 they didn't have towards stimulating the local economy of 3,300 residents. Each adult received up to $1200, and children $500. Every single person owed an average of $6,700 towards the loan, though, and over 200 working adults lost their jobs in the meantime. That means 1 out of every 10 working age adults became unemployed. The final oddity is that many emotionally charged residents spend a large portion of their days chiding the other residents for not doing enough, or for doing too much, to stop this virus. In fact some are openly hostile to anyone who couldn't understand the unprecedented aspects the city council (who incidentally averaged over 60 years of age, while the highest ranking were in their 70's and 80's and extremely wealthy) demanded. The final objective outcome: 9 years of total life are lost. The town of 3,300 could have reasonably expected to live a combined 259,050 years, but instead only lived 259,041 years. In other words the town is only going to collectively live 99.997% as long as they expected to. On the other hand, 10% of working adults became unemployed and every resident took on $6,700 of city council debt. Kids school years were cancelled. Almost all QOL was negatively impacted. Even Thanksgiving dinners amongst family and friends are vilified. Maybe the saddest part is that half the population thinks it's ing absurd that so much was spent in money and alterations to daily activities for such a meaningless loss of life, while the other half openly rebukes the city council and their fellow citizens at how little was done to handle the situation, and that nobody is doing nearly enough to stop the spread of the virus. TL;DR - If you don't think your fellow Americans have done enough to combat COVID, or that they are being flippant and selfish by wanting life to continue, I don't see how others like me can ever take you seriously. It makes one wonder if objectivity is dead in the age of social media and shock news.1 point
-
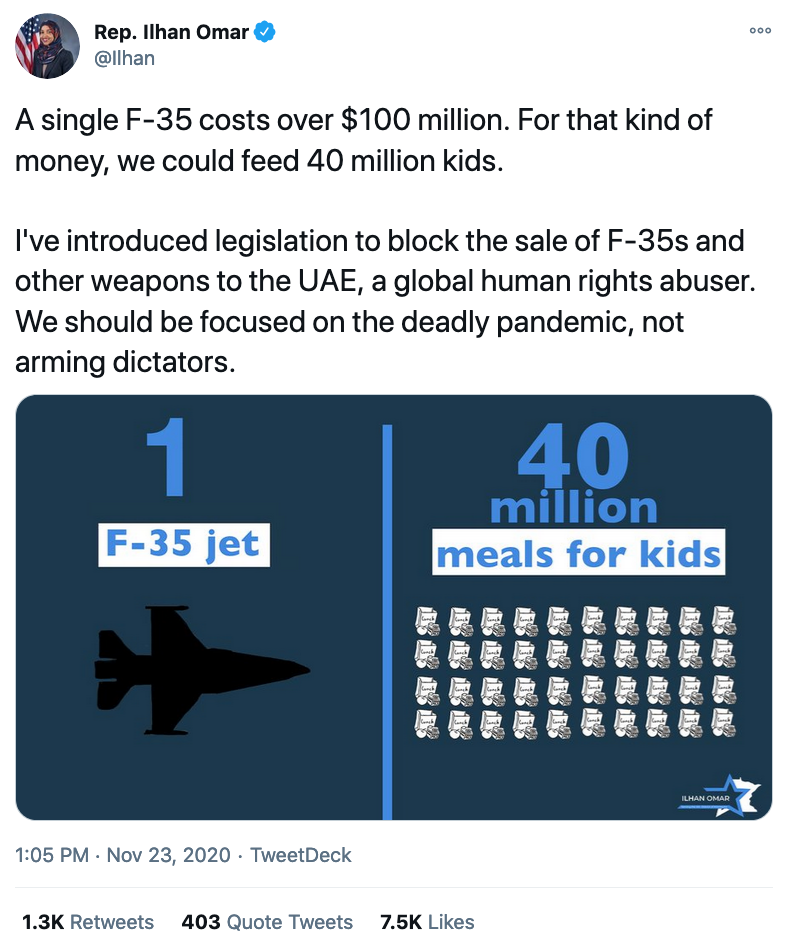
Because blocking the sale of US exports, manufactured by US moms and dads, feeds kids. UAE would probably be disappointed with their "F-35s", anyway.
 1 point
 -
1 pointOne of the many reasons I recommend to all my AD bros avoid the reserves, especially units at AD bases. I continue to be amazed by the guys that say they're done with the AD bullshit, then join an AFRC squadron that is embedded in the AD wing they just "left," and complain that not much has changed (not directed at you). Also, more of a reason to be a part timer, as your give a fuck about extraneous bullshit is near zero. Even more so if you're at the rank in which you don't mind retiring. Stand alone ANG is the last bastion of hope in the ARC. Even better if you do it as a part timer.1 point